 |
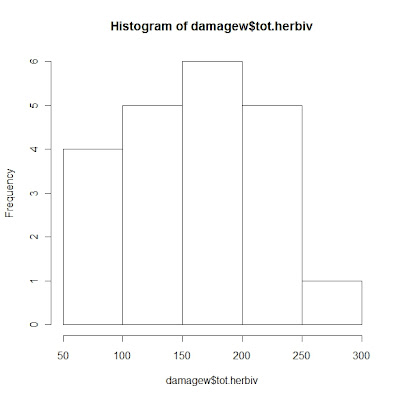
| This is the histogram of different shrubs to the total number of herbivory counts. Fortunately, the graph isn't right or left skewed. |
 |
| This is the plot of total herbivory in relation to the type of treatment. From the looks of this, there isn't much herbivory variation between the different types. |
Response: tot.herbiv
Df Sum Sq Mean Sq F value Pr(>F)
Trmt 2 3580 1790.1 0.4844 0.6239
Residuals 18 66516 3695.3
In the previous post, I had hypothesized that there would be the greatest variation of herbivory counts between the control and exclosure, but the analysis and plots of the data entered shows otherwise. In the meantime, I've separated the arthropods that Lizzie vacuumed off of various shrubs from last year, measured their lengths, and have put them in the dryer, which will then be weighed to determine their mass. I will also be separating and drying new from old growth on the shrub samples to be weighed so that we can determine the ratio of herbivory to biomass. After Lizzie and I meet tomorrow, we'll be coming up with the next few steps of what's left to be done, and hopefully we'll have more conclusions to display when we finish.
No comments:
Post a Comment