Thursday, June 23, 2011

At long last

It has been a while, but I've finally found time to write up this graduation blog, *whew*

The week after I went out into the field with Lizzie was finals week, which was great! No really, it was a great week, especially since I decided that that was a good week to try and finish off items on my bucket list for UCSD before commencement while trying to remain focused on my senior research paper. There were just so many things to do before I graduated (such as running around campus at midnight finding all the art pieces in the Stuart Art Collection), though unfortunately, I didn't get to go around and finish my list. But by the time commencement rolled around, I was happy enough with where I was.

One thing I do have to say is that commencement was overrated. I thought it would have been a bit more grandiose; I was wrong, though the bagpipes that were playing while my graduating class walked in was exciting (it may have been the most exciting portion of the ceremony). Two hours later... I'm a college graduate!
Just smell that freedom!
And now that I've joined the (part-time) working world, I'm think I may miss the work and schedule that comes with academia, but who knows? Maybe I'll be back in it again some time in the future. For now, I'll enjoy this summer in La Jolla and play things by ear until September rolls around, how exciting!

Saturday, June 4, 2011

The hills are alive

...with the sound of music! Or the wind, which was more the case. However, when I was working throughout the day in the field, I barely felt the wind blowing sometimes (it was hot, but Lizzie says that it wasn't as hot as it could be...I'll take her word for it).  Lizzie picked me up from the vicinity of my residence at around 7:00am, and from there, we drove about 30 minutes to the experimental site where we started our work. For about 6 hours, most of our work consisted of these steps:
Find the exclosure and/or sham. Sadly, I am almost completely covered by the surrounding shrubbery.
First, the cable ties have to be removed before the netting on the exclosure can be taken off.
This is followed by multiple strikes to the rebars to loosen them from the ground.
If that doesn't work the first time around, intermittently hammer while moving the bars from left to right before pulling.
After the rebars are removed, roll up the salvageable chicken wire to be ready for transport.
It was pretty grueling work, but I enjoyed it for the most part, despite the fact that we had to cart everything to the car at least 3 times. I believe that was about 15 minutes downhill with equipment and 10 minutes back uphill to get to the rest of items left behind; it was like an edition of Extreme Makeover: Gardening Edition/Field Work. After all this work, Lizzie and I had a Jamba Juice smoothie, which tasted like heaven after a hard day's work. Then we drove back to campus, and dumped the rebars in a dumpster and moved the rolls of chicken wire into the lab. *whew* I didn't realize until the next morning exactly how sunburned I was, haha. I just thought it was hot, considering the weather that I'm usually used to, which is nice and breezy La Jolla. Despite the now chafed and red arms and shoulders I have, I enjoyed my time outside, and the physical labor required to do this type of work. I have to say, this is a great way to end the quarter, and a better way to end a memorable internship experience. :)

Wednesday, May 25, 2011

Part 1 complete!

Huzzah! I have finished my poster for my ESYS symposium that is tomorrow night. I do believe that I spent as much time on the alignment of my text boxes and figures as I did with the content itself...hm. But the result of that is a poster that I am very satisfied with aesthetically!

I have to say though, it was difficult to figure out how to get this plotted...and I went through a somewhat complicated process of converting files, printing to two different printers (one to get the print preview/quote and one to print), and then making more minute changes to my poster. However, thank you Academic Computing Services for offering this service at a price 4 times cheaper than what Imprints offers its students. Now all that's left to do is to go through the rest of the graphs that Lizzie sent me for my paper and work on that, after I get through my poster presentation of course. I'm excited to see what my fellow ESYS classmates have been working on for their internship these past 2 quarters as well.


 ::post-ESYS symposium 5.27.2011::

It was great seeing everyone's posters! Everyone was dressed up very nicely as well and had good presentations of their internships, which varied from educational outreach programs to specified scientific research topics. All in all, I think the symposium went well, especially since there were many community members, alums, and other faculty and staff members that came to see everyone's internship work.
Lizzie insisted I present my poster, so here I am!
We also had a few former ESYS alumni come and speak at the reception and gave recognition to the faculty and staff that work behind the scenes and helps make the ESYS program work smoothly. The ESYS symposium concluded with a class of 2011 picture (which I've yet to receive), and it was quite sad for a few moments as we all stood there together thinking about the culmination of our project and our years at UCSD. I, for one, am glad that I came into the university with this major, not knowing what it was but leaving the school very satisfied at the road I've taken these past 4 years. Only a few more days to go!

Friday, May 13, 2011

A whole new world, a new fantastic point of view

It has taken about 2.5 months, but at long last, all vacuum sampled and frozen arthropods from Lizzie’s collection have been processed! There are a few minor tasks that I have left to do with them, such as comparing vouchers, but that will most likely be done in a short bit. 

Now, to say that I didn’t recognize the arthropods until more than halfway through the samples is an understatement. I had to re-familiarize myself at each sorting session what the types of arthropod were, and that in itself took a long time to become acquainted with. After many sessions of bug identification frustration, I finally decided that I was going to go and capture these bugs on camera and store them on my laptop when I sort through the rest of the samples. Here are a few pictures of some of the arthropods I caught on camera:
This is a one of a kind bug I found in the samples, though I'm not really sure what it is.
This is one of the many auchenorrhynchas (what a mouthful) that I saw while sorting. What a beauty.
There were many flies in the samples, this one I labeled as 'diptrs' for red stripes.
This one is my favorite since it reminds me of the alien from the movie, 'Aliens'.
I made note to take pictures of them from as many sides as possible, since I couldn’t be sure whether or not if a single picture was enough to help me identify future samples. As it is, I feel like my pictures, which made identifying arthropods much easier later on, are not as clear as they could be since they do not capture all the details on the insect bodies. I would also have trouble with the light on the microscope and in how I centered the camera lens on the microscope lens, since it required multiple minute tweakings of both camera and microscope lenses. I ended up zooming my camera lens to the max and the microscope to 3x the magnification and then centering the camera lens on the microscope lens before I found a middle point where I was satisfied with the quality of the photos.

But doing so did help me match up bugs closely, or at least, better than I did before. Now that Lizzie is back, and brought with her her vouchers of these little guys, I can match up my vouchers with hers and see how to better create a system for identification. Ta da!

Happy Friday everyone, and happy Sun God!

Tuesday, April 26, 2011

Yay for summer! I mean, um...

For weeks, I've been battling one of the seven sins...sloth. It's almost difficult to bring myself back to work, especially with the nice weather we've been having the past few weeks. However, I've finally been able to pull myself slightly back into a working mode and am now going to present to you a portion of what my ESYS paper will be talking about.

A majority of the data I've gathered for my paper is based off of work that involves bird exclosures experimentation. In the data that I gathered, they were 3 types of shrubs: exclosures, shams, and control shrubs. Another variable of this experiment was whether or not the shrubs were surrounded by low or high grasses. To better illustrate, here is a picture of an A. californica bush that Lizzie did her experiment on at Sweetwater NWR:
This is a low-grass bird exclosure shrub. Cute!
From these shrubs, Lizzie collected samples from the shrub itself and vacuumed arthropods pre- and post-experimental period. These samples are what I have been working with for the past few months (albeit slowly), and although there has not been much analysis done on the data gathered, in terms of herbivory, there is not much difference between the different treatment types (previous blog post). As for the post-experimental period samples gathered, I have noticed while sorting the arthropods that some shrubs would have a high quantity in the vacuumed samples. I'm not sure if this is due to the amount of actual foliage that was vacuumed, as some sample bags had more (or less) in terms of volume, but there should be more information about this answered as soon I'm able to enter in all the data concerning the types of arthropods I've sorted.

Monday, April 11, 2011

Questions? Comments? Concerns? ???

I have many of those, especially questions that starts out with, "What the heck am I writing and how?" In brief (and frequent) moments of confusion, I ask myself that, especially when I'm beginning to carve out my outline and tentative final paper. Like I've said in the past, I find it hard to get started until I sit down and actually force myself to think about the topic at hand...but even then, I find myself at a loss for words. So, in the best possible way, I will try to translate my mumble-jumble of thoughts and ideas and translate them to a semi-understandable and logical way. Here is my still-and-must-be-continually-edited version of an abstract/summary:
There is a top-down control on arthropod communities by bird predation which leads to trophic cascades that affect shrub biomass. In doing bird exclosure experiments, we can determine whether removing these large predators on arthropods will affect the size and quantity of arthropods present on experimental shrubs and if this in turn, affects the amount of plant biomass. We expect there to be differences throughout the three types of experimental shrubs; the control, sham, and exclosed shrubs should contain the least to the most amount of arthropods, respectively. With this expectation, we will try and predict if the following are true: (P1) California sagebrush shrubs in bird exclosures contain higher amounts of larger arthropods (past a certain size), which causes trophic cascades; (P2) there is a higher new to old growth ratio on control shrubs than on shams and exclosures due to higher amounts of arthropod predation by birds. The absence or presence of birds may be used as an indication of how temporal variations of coastal sagebrush habitat are affected by fluctuating seasonal temperatures. It is important to understand how these tertiary consumers will impact trophic scales down to the plant level to see if changes in migratory patterns of these consumers would affect consumer and producer interactions within the community.
As of this moment, I am still trying to further flesh out and rewrite my thoughts and ideas, but for the most part, this may be my writing at its most coherent. The more difficult part of writing this was trying to figure out how I can have my readers understand why they should be interested...I'm still working on trying to find the "Wow!" factor. This is a painstakingly slow work in progress, but in the end, slow and steady wins the race (at least what we're taught to believe in Aesop's fables)? Go brain, think! And go fingers go! Write!

Monday, April 4, 2011

Here comes the sun---doo do doo dooo

Welcome to spring (quarter)! This celebratory quarter is appropriately heralded by the wonderful and toasty sunny days that have finally arrived, and now we can really call this place sunny San Diego. This week has been quite hectic, with me being sick and all while volunteering for the Clinton Global Initiative University for the past two days. Former President Clinton is a great public speaker, and I greatly enjoyed being able to hear him discuss about various social justice issues and topics with the panelists.

But to get back to the blog on hand, spring quarter also means the revisiting of bioinformatics work! To start this off, Lizzie assigned me with the task of going through a list of plant species through the Kew Royal Botanical Gardens database, which I have to say, was much easier to do than going through previous data sets in the past. This database is a mix between USDA Plants and Jepson Online Interchange in that I think it is aesthetically pleasing to view and to read the information, props to you Kew Gardens webmaster. The site in general is easy to navigate, and the database is well organized, easy to read, and contains information by category type and color-coded, something that gives it a bit of character unless the viewer is color-blind, in which case the viewer may be out of luck. I was able to obtain a majority of the information for seed mass of the species listed on the data set from this site, but I may have to poke around elsewhere to obtain other information, such as seed numbers, genome size, and any other random, but relevant information.

This, by the way, is the time it takes to arrive by bike.
While going through and viewing the Kew Gardens site, I remembered what Lizzie had said about arboretums being large plant museums and thought, "Hey, maybe I should check out the one close to home...How close is it anyway?" Thanks to Google Maps, I now know that I live approximately ~10 minutes from the Los Angeles Arboretum and Botanical Gardens (and ~10 minutes east of The Huntington Library, which also contains a botanical garden). Sadly, the LA Arboretum is only 127-acre, small when compared to the 300-acre large Kew Gardens. Maybe I should visit the next time I'm in the area...or I can simply wait for the resident peacocks that wander in the park to come visit me.

::edit 4-8::
Ok, I take back a portion of what I said about this data set being "easier" to complete than the others in the past. Seed mass was easy to get, everything else however...not so much. The "everything else" includes chromosome number, ploidy level, and C-value of the plant species. This is now a familiar position that I find myself in, because searching for this information on the data base often comes up with the page that states "No rows returned by this query. Try selecting different conditions." This translates to my data set being splotchy and sporadic in the information that I can find and have input into Excel, but not to worry because the search for this information will continue!

Monday, March 21, 2011

A (brief) break

Today is officially the first day of spring break, joy! Well, technically spring break started on Saturday, but that's besides the point. The point is that everyone (most everyone?) gets a week off to relax, go someplace relaxing, and enjoy the weather...or not. I can't put my finger on it, but there's just something off Mother Nature's timing, because it is indeed raining. Again. Or maybe it's because the powers that be in the school system knew of the incoming rainfall and deliberately scheduled break so that it would coincide with these storms. I guess we'll never know.

But never fear because spring quarter is near! I'm excited for my last academic quarter, and the work/fun that the quarter will bring. Looking back, I didn't think that I had done much this past quarter, but looking back at all the work that was done, it was quite an accomplishing quarter. There was the herbivory counting on the shrub sub-samples, all 21 of them), which was followed by going through the full samples and separating them by new and old shrub growth that were dried and massed. Then work with the arthropods come in, starting with measuring the length and dry weight of larvae pre-bird exclosure experiment, and then sorting the post-experiment arthropods. *whew*

So in this upcoming quarter, I'll be continuing the lab work that I've been doing, which includes finishing the sorting of the arthropod vacuum samples and vouchering them as well as picking up the phenology work that I did during the fall. On top of that, I'll be writing my scientific research paper on this past quarter's work and present it at my ESYS symposium in May.

In the meantime, I'll enjoy my opportunity to mentally vegetate for a week and be ready to go starting next Monday!

Thursday, March 17, 2011

And back again

Hello all! Now that finals are over, for me at least, I bring you back to the dry weight of arthropod larvae that I did a while back and publish this post on the comparisons of the bug biomass to its length. But before I get started, some graphs that I ran in R to help illustrate what is going to be discussed.
Figure 1: Here is the original graph when simply plotting out the length of the arthropod larvae to its biomass. Though some details escape the plot, there are 3 points on this graph that show a different type of larvae (dark red circles).
Figure 2: After doing a log transform, this is what the data looks like; much data pertaining to body size are non-linear. There is now more of a distinction between the two types of arthropod larvae. 
Figure 3: Voila! These fit lines better help illustrate the relationship of each type of larvae length to biomass.
And so, we get to the meat of this discussion. To start off, I had collected 37 individual arthropod larvae samples, in which they totaled to about 0.2375g in dry weight. A majority of these samples happen to be of a type of Coleoptera larvae, with the 3 exceptions that were Lepidoptera larvae, and they show that there is a significant increase in weight as their length increases. This appears to be influenced by factors such as body shape, feeding habits (herbivorous or predatory), and the metabolic rate of animals etc[1]. The general idea that can be assumed is that the more an arthropod eats (higher herbivory counts on A. californica), the bigger in mass it becomes, until a certain threshold point. Looking at Figure 1, there seems to be a cutoff value at around 12 mm for arthropod larvae length, which I assume is the maximum size larvae grow to before they are either consumed or pupated. This is useful to know because in such cases, species biomass may reflect functionality more accurately than abundance[2].

It might be more presumable to think that this is due to bird predation because the larger these larvae are, the more conspicuous it is on the sagebrush leaves. This leads to the possible conclusion that there could a top-down effect on the arthropod community, but only on the larvae in the earlier months, and not necessarily on the mature arthropods that appear closer to summer. Maybe the earlier hypothesis that I came up with should also include a comparison of temporal variation of herbivory; it would be interesting to see if the data changes at different times of the year.
_____

1. Sage, R.D. 1982. “Wet and Dry-weight Estimates of Insects and Spiders Based on Length.” American Midland Naturalist 108(2): 407-411.
2. Saint-Germain, M; Buddle, C.M.; Larrivee, M; et al. 2007. “Should Biomass be considered more frequently as a currency in terrestrial arthropod community analyses?” Journal of Applied Ecology 44: 330-339.

Wednesday, March 2, 2011

Eureka!

At least, that's what I think most times I find a new type of arthropod that I haven't seen yet in Lizzie's vacuum samples. She got me started on sorting her bug samples by morphospecies by first going through them and meticulous scanning and collecting them from the trays. I find it rather like a "Where's Waldo?" book, but much more complex and more miniscule. Here are some pictures to illustrate this process:

Just keep searching, just keep searching, just keep searching searching searching...
Bug of interest has been found!
Naturally, this is repeated many times over and it is more eyestraining than looking for herbivory on the shrub samples through the microscope, but I find it much more enjoyable. The only problem with this is that I end up spending too much time on each sample bag combing through the litter for bugs that are sometimes <1 mm large and often in a contorted shape. I am hoping to figure out a tempo for how I look for these critters soon so I can become more efficient at searching and memorizing their features. I also hope to be able to take pictures and make some sort of comprehensive pictionary of these insects, but we'll see how time will work out. There's effectively 1.5 weeks left until finals week, got to get cracking!

Thursday, February 24, 2011

Pictures are worth many words


Hopefully the flash works since I decided to try putting pictures in a slideshow for the sake of saving space. However, if it doesn't, I have provided the link to the album here.

To better narrate the story, I spent a few hours sorting through the arthropod samples that Lizzie had in the fridge, measuring their lengths, drying them, and then weighing them for their mass. Later on, we hope to be able to determine whether or not there is a correlation between arthropod weight and amount of herbivory on the shrubs.

The rest of last week was dedicated the remaining shrub samples and sub-samples that were still in the fridge. I separated them into new growth and old growth bags, with new growth being anything that contained leaves and were still "green" and old growth as everything else. These bags were also popped into the dryer, which sat there for ~96 hours each before I were able to measure their weight. To account for the paper bag weight, I also included 4-5 empty paper bags which were dried as is and weighed before I took out the samples. I'll most likely be adding more information here later on to show what our analysis of the data brings us. Hopefully it's something exciting!

Sunday, February 13, 2011

Mas o menos fin!

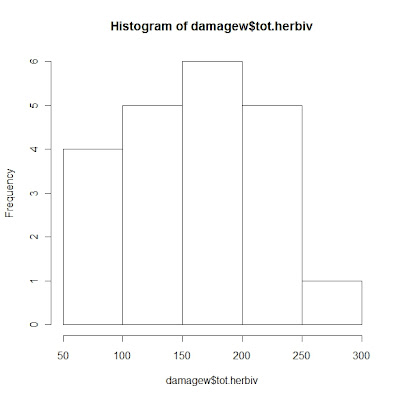
I'm happy to report that manual data recording of herbivory is finished! After editing the excel sheets and entering the data, Lizzie wrote up several R codes to run the data through some statistical analysis and to plot them out. I was able to run them again myself from my trusty laptop, and here are some of the charts for the data:

This is the histogram of different shrubs to the total number of herbivory counts. Fortunately, the graph isn't right or left skewed.
This is the plot of total herbivory in relation to the type of treatment. From the looks of this, there isn't much herbivory variation between the different types.
Analysis of Variance Table

Response: tot.herbiv
                 Df      Sum    Sq Mean Sq   F value     Pr(>F)
Trmt           2      3580      1790.1        0.4844     0.6239
Residuals  18     66516     3695.3              


In the previous post, I had hypothesized that there would be the greatest variation of herbivory counts between the control and exclosure, but the analysis and plots of the data entered shows otherwise. In the meantime, I've separated the arthropods that Lizzie vacuumed off of various shrubs from last year, measured their lengths, and have put them in the dryer, which will then be weighed to determine their mass. I will also be separating and drying new from old growth on the shrub samples to be weighed so that we can determine the ratio of herbivory to biomass. After Lizzie and I meet tomorrow, we'll be coming up with the next few steps of what's left to be done, and hopefully we'll have more conclusions to display when we finish.

Thursday, February 3, 2011

Short, but sweet

Hello everyone!

Shrub sub-sampling has been great so far. It took a while, but I have finally established a rhythm and method of how to count for the different signs of herbivory without having to consult the data sheet after ever observation. From the data that I've gathered so far, I would hypothesize that there would be the greatest amount of herbivory (nibbles and side-crunches) on the shrubs in the bird exclosures and the least amount on the controls. I think that this makes sense since the exclosure would keep out birds that would eat arthropods, creating a top-down control and the amount of damage arthropods would wreak. After I finish the rest of the samples, I will be inputing the data into an Excel sheet and then Lizzie and I will see if the predictions are true. To conclude this short post, I present a picture taken with my point-and-shoot camera through the microscope lens (which took me about 20 minutes to figure out how to do, James made it look so easy...)

Surprise!
I found this cicadellid while sampling. It was very exciting, I ended up poking/playing around with it for a good 5 minutes.

Oh yes, and a Happy Chinese New Year to all. May this year bring about great discoveries and festivities in the Year of the Rabbit.

Friday, January 28, 2011

Through the looking glass

On Monday, Lizzie and I worked on coming up with a procedure to determine herbivory from shrub clippings by looking at them with a microscope, which is actually harder than it sounds. Until I actually saw it in person, I had no idea how small the leaves on the Artemisia californica would be... *whew*. But to better illustrate the process in which we decided to try, here is "How to Determine Herbivory" in five easy steps:

Step 1:
Remove bagged and frozen samples from the fridge.

Step 2:
Sort through the clippings for evenly sized samples. Because not every bag has the same amount, use your eyes to visually judge the amount of foliage you believe is the best to sample (3-4 individual samples should be sufficient).

Step 3:
Take your small clipping and put it under the microscope. Carefully move it around to examine the sample for signs of herbivory (i.e. galls, nibbled ends, etc)

Step 4:
Write down results on the accompanying data sheet.

Step 5:
Repeat steps 1-4 until finished with day's worth of samples.

So far, through our initial trial, we've found that we can classify most of the plant damage into three categories: galls, side-crunch (entire sides of leaves gnawed), and nibble (small bites into leaf or at the tip). There were the occasional anomalies, such as this cotton-ball like substance I found on a few of my samples, and the waxy exterior that some of the leaves seemed to have. But in all, these discoveries were exciting to see through the microscopes since everything looked so much better magnified.


::edit 1-29::

I've found that working in the Holway Lab has its perks. For example, I was able to talk to Professor Holway about some of the observations I made, such as the cotton-ball I've been seeing on some of the samples, and he said it's most likely another type of gall (Lizzie also confirmed this after emailing and asking around for answers). I was also able to talk to one of the PhD students, James, about another observation I made later in the day. I had asked him to look at it, but he wasn't able to view it through the microscope (which by the way, is a fantastic piece of equipment). James came up with an ingenious idea of taking a picture of what I was seeing through the microscope itself, and this is what came up:


I'm not sure exactly what this is, but I have assumed that this is a may be a scale insect. Until I have further confirmation through readings (or through the power of Google search engine), I have written down these occurrences as a separate category. In the meantime, I will rest my eyes up until Monday's sample scoping adventures. New discoveries await!

Monday, January 24, 2011

TMI


Until Lizzie told me to mentally force myself to write down hypotheses for these papers I've been reading, I have to say that I definitely had too many conflicting ideas floating around in my head, literally. Floating as in, "I think this is what the authors are saying but I'm not really sure because I'm already thinking about the other two articles I just read" kind of floating.


So needless to say, actually sitting down and writing 6 different hypotheses on floral reflectance in relation to phenology and pollinators was a daunting task (I had fortified myself with two delicious Klondike ice cream bars before I started). But I believe I have come up with some hypotheses, please excuse me if they are not as original or understandable as they could possibly be:

1) Floral reflectance variability differs depending on the time of year which the plant blooms.
2) Exotic, invasive plants have higher ranges of color spectrum variability to attract native pollinators (discriminated through human vision).

Another note, I wrote out these hypotheses before I read some more papers, one of which included Flower color phenology in European grassland and woodland habitats, through the eyes of pollinators, written by Sarah E.J. Arnold, Steven C. Le Comber, and Lars Chitka. Fortunately (and somewhat unfortunately), their results showed that there was no trend in woodland flowers blooming in particular months to share the same color more often than expected by chance, "as one might predict if particular colors dominated at certain times of the year..." Their results (technically) nullified my first hypothesis since I do not know if this is true among other biomes, but it was a good discovery. The article in itself was a good find as well, since the authors included phenology tables for five habitats, and organized plants by family, genus, and species in regards to their flower colors (humans and bees). I'll be inputing this data into the known modes tab of the plant traits document I've been updating, but I think I'll save that for some time later during the day. So long for now!

Wednesday, January 19, 2011

Hello FReD!

This week, I was given the task of doing several literature reviews on floral reflectance in respect to pollinators, one of which was called FReD: The Floral Reflectance Database-A Web Portal for Analyses of Flower Colour. This paper, which was published and can be accessed freely on PLoS ONE, can be viewed as an instructions manual of how to access and use this database for researchers to "...download spectral reflectance data for flower species collected from all over the world." I've included a print screen to show the data that comes up when I hit the search button:
In this screen-shot, I've categorized the entries by country of origin (where the data was collected).
I think that once this database contains more information, it will be a great key tool for researchers wanting to find out what type of color (viewed through human eyes) are most likely to attract the attention of bees. However, a few problems that I have with this at the moment is that there are only 899 records on the database, which limits the amount of information that can be gathered. Second, in relation to the work that Lizzie has assigned me, this database does not provide information on plant species in the U.S., and instead has much more floral information about plants mainly in Brazil and Germany. Lastly, this database is highly focused on bees and no other types of pollination modes by animals (i.e. hummingbirds, beetles, etc.). Despite these limitations, FReD has been set up in a very user-friendly mode that makes it easy for anyone to search up information.
The drop-box selections and check boxes allow users to control what information they wish to have presented.
Going back to this paper, however, the writers have brought up several interesting points about pollinators' sensitivity to different wavelengths of light, and in short, floral reflectance. The reason that FReD was developed is to provide access to flower colors are "...not inherently human-biased and which can be used when considering the interactions between floral appearance and the visual systems of pollinators." This brings up several other papers that Lizzie printed out for me to read, and a few that I've browsed on ISI Web of Science, but I've decided that I will save that post for a later time. Stay tuned for more information!

Saturday, January 8, 2011

Happy (belated) New Year!

Hello all!

The holidays have come and passed, so now it's time to get back into the swing of things. Where we last left off, I had just finished the last of my assigned work that Lizzie gave me to do...and now, it's time to pick the pace up again. I'll be updating the ongoing master output list, which will hopefully also cut down on the amount of time and need-to-find info that I will be working on for these sites. Looking at it now, the list is larger than I last remember, but never fear! I'll be tackling this one location at a time, starting with the kochmer site and slowly making my way down the list Lizzie has posted.

Another project that will be happening this quarter involves the Sweetwater NWR area to look in on exclosures to determine the important of interactions between arthropods and birds in the area and how they affect the fauna. However, considering that southern California received copious amounts rainfall during the holiday weeks, I think that there is a high possibility that the area could either be washed out or at the very least, inundated. Lizzie on the other hand, would like to say otherwise and disagree with my prediction; we'll be able see who is right once we head out there to check out the area.

Exclosure! Or at least, half of it. This is also used to test the intelligence of birds (just kidding!)
And with this said, hopefully the next update I have will include my progress on getting information for the sites listed, and have non-weather related information.